Week 39: cumulative Performance Oil - and Gold ETF's
How to benefit from the zero correlation between oil and gold to reach a market independent positive performance.
2Y Express Certificate cumulative with Memory Coupon and optionally a European Barrier or a Low Put Strike.
Oil and gold show a correlation near of zero for the past 5 years. Furthermore there is a negative correlation between gold and most of the stock markets as well as the long term interest rates. Whereas there is a correlation between oil and these markets.
Possible developments and impacts to the oil- and gold priceI
Scenario 1
It comes to a financial crisis with a subsequent recession and a looser monetary policy. There is no intervention from Opec to support the prices. The oilprice would be under huge pressure. The gold prices could jump over the all time high. Some experts see a potential up to 5000 USD.
Scenario 2
The geopolitical crisis might escalate and it comes to armed conflicts between Iran and the US. The oilprices will increase sharply and also the gold price will rise.
Scenario 3
The trade dispute between China and the US expands and the result is a global recession. The Opec interferes to support the oil price. A price decline below 50 USD could be avoided. The gold prices instead will rise which illustrates the risks for states an company collapses.
Scenario 4
An agreement in the trade dispute between Iran and the US reassure the markets. There is a stimulating effect on the mood of the decision-makers and the result is a global economic recovery. Gold is no longer needed for hedging activities so the price will decrease. In the long-term the rising demand caused by the prosperity supports especially emerging countries like china and india. The oil prices will benefit from the rising demand.
Scenario 5
The geopolitical uncertainty will remain because of the consistently disputes between Trump and Teheran. The relaxed monetary policy results in a good mood of the economy. This leads to increasing gold prices to hedge possible inflationary trends and also because of the risk of a weak USD. Oil is still in demand and the price will rise.
We have integrated 2 interesting ETF's in our cumulative basket, which shows the gold and oil price developments in different ways.
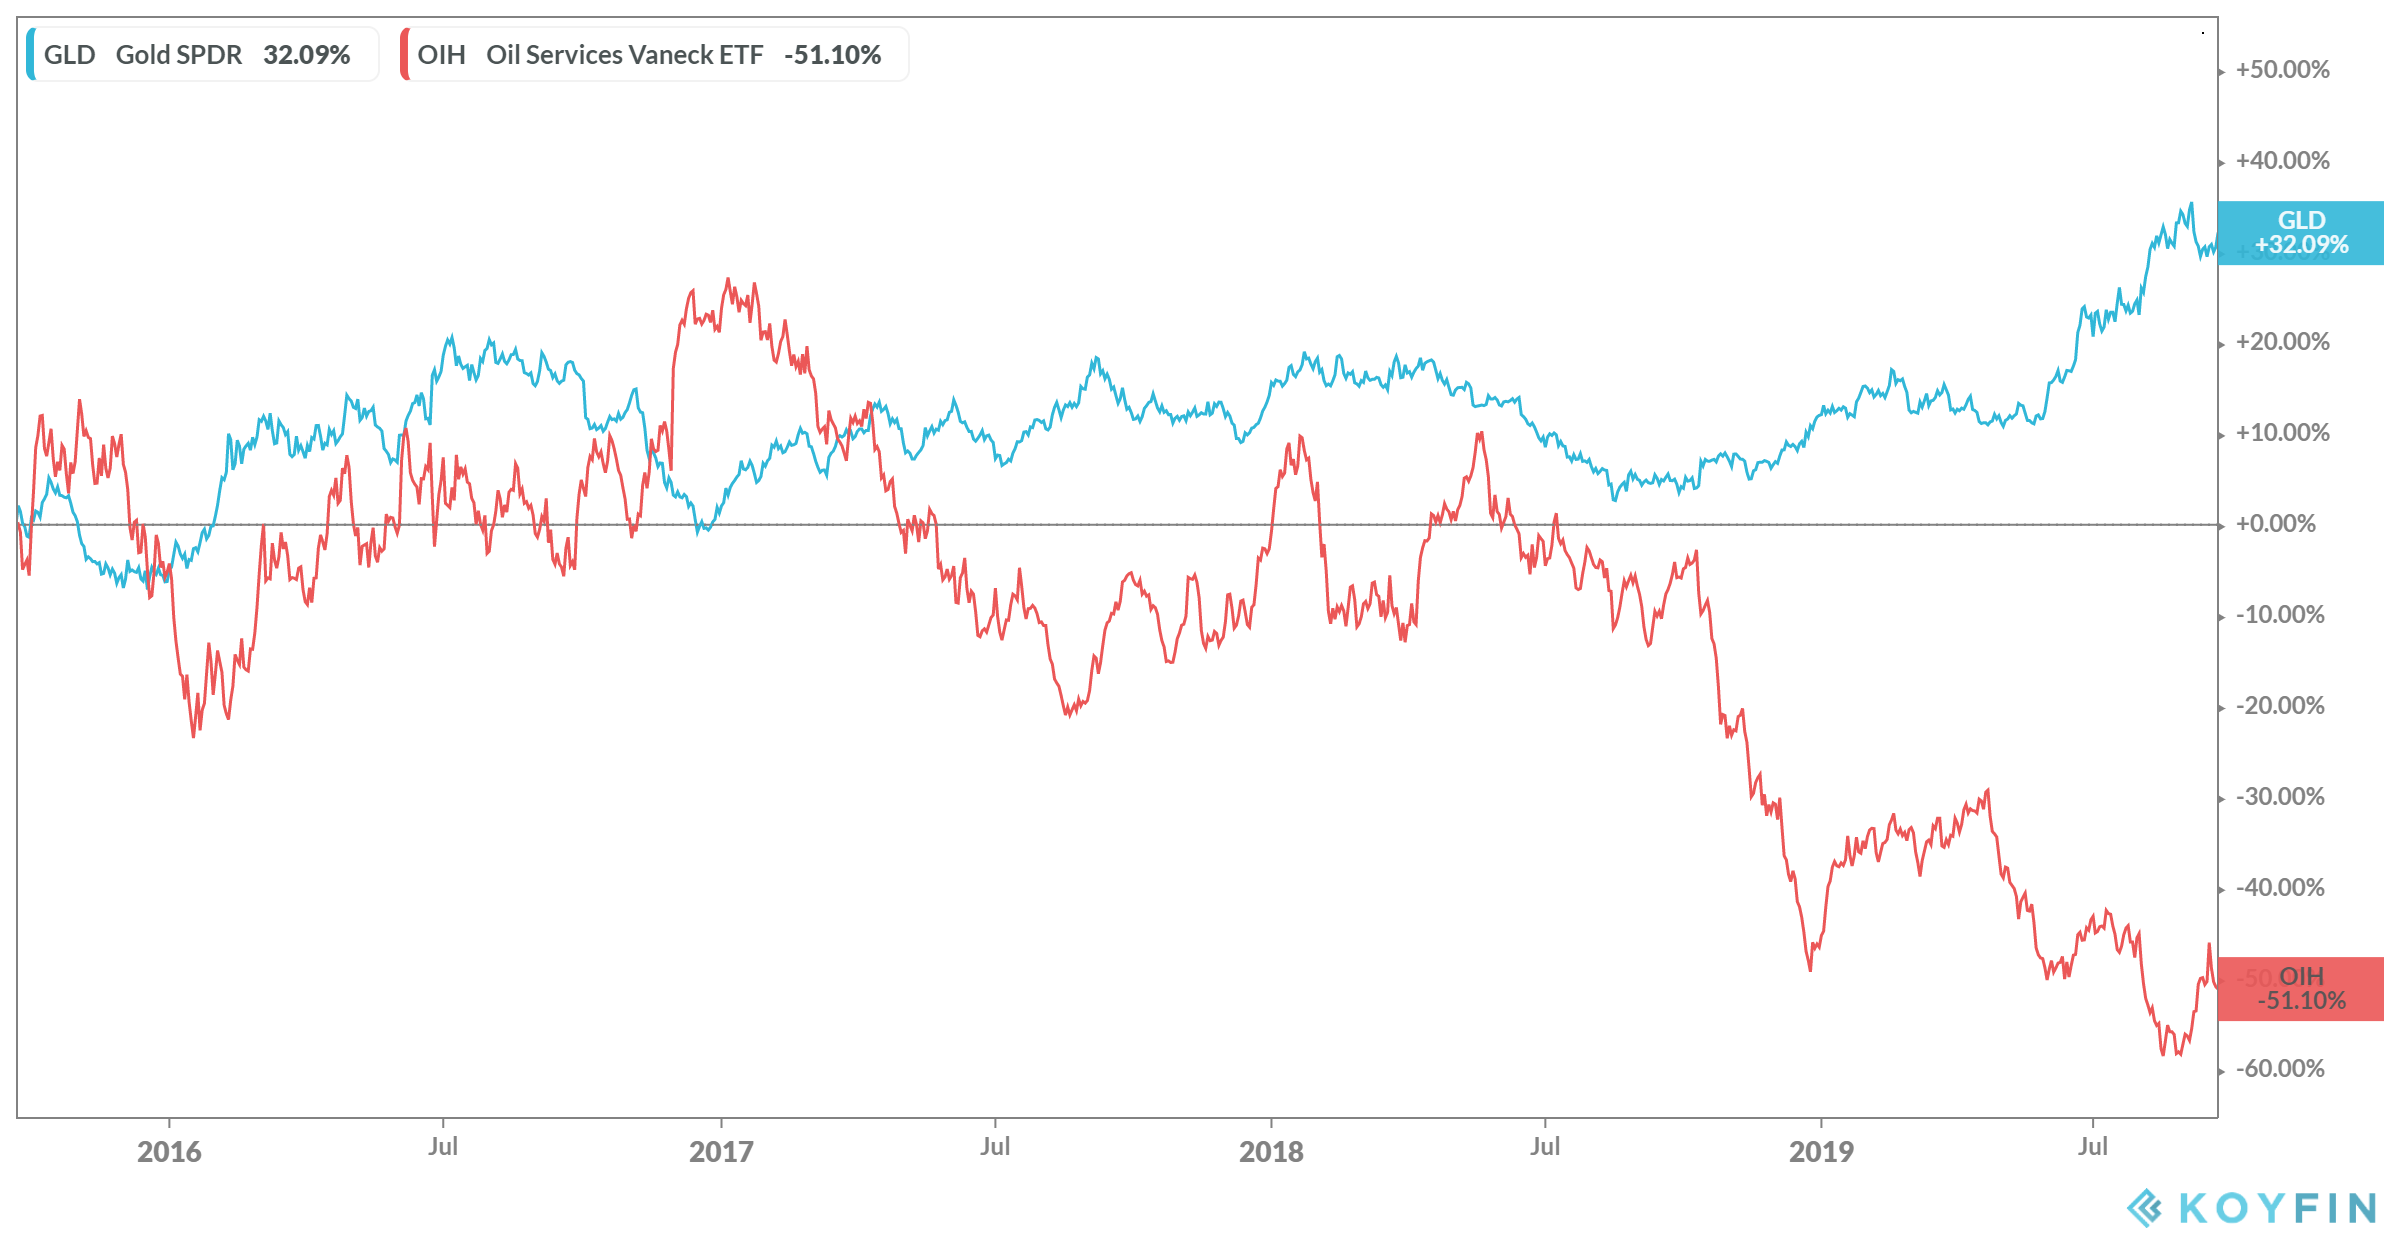
- SPDR Gold Shares The indexfund is considered as the biggest gold-product traded on the stock exchange in the world and also as one of the largest ETF's ever. The fund demonstrates the development of the gold price and is replicated by physical gold.
- VanEck Vectors Oil Services ETF This ETF shows the development of the MVIS® U.S which demonstrates the 25 most important companies in the area of oil facilities, oil services and oil drillings.
Through the selection of the VanEcks ETF's the correlation of oil and gold changed from uncorrelated to negative correlated (see chart below). The cumulative basket settles the positive and negative performance which mutually offset each other. The opportunity of a barrier event respevtively the shortfall of the Low Put Strike is reduced.
| Currency | USD Quanto | |
| Maturity | 2 years (subject to early redemption) | |
| Underlying (cumulative performance) |
VanEck Vectors Oil Services ETF (OIH:US) SPDR Gold Shares (GLD:US) |
|
| Coupon | 5.00% p.a. | |
| Coupon Barrier | 68% (with memory) | |
| Coupon payment | Coupon will be payed if cumulative basket performance > 68% on relevant observation date | |
| Observation | Yearly | |
| Version | European Barrier | Low Put Strike |
| Product Barrier / Put Strike | 68% (observation at maturity) | 87% (observation at maturity) |
| Trigger | 100% | |
| Early redemption | Product will be redeemed at Trigger level if cumulative basket performance > 100% on relevant observation date | |
| Issuer | Rating A minimum | |
| Initial fixing | 23.09.2019 | |
| Issue price | 100% | |
| Finders fee | up on request | |
Redemptions European Barrier vs. Put Strike
| Performance of the cumulative underlying-basket at maturity | Redemption at maturity with 68% European Barrier | Redemption at maturity with 87% Low Put Strike |
| +25% | 100% | 100% |
| -10% | 100% | 100% |
| -20% | 100% | 91.95% |
| -30% | 100% | 80.46% |
| -40% | 60.00% | 68.97% |
| -50% | 50.00% | 57.14% |
| -60% | 40.00% | 45.98% |
| -70% | 30.00% | 34.50% |
| -80% | 20.00% | 22.99% |
| -100% | 0% | 0% |
We are happy to customize the relevant components exactly to your personal preferences. Imagine that these datas are indicative and can change at any time
Are you interested in this topic? Please contact us and we will replicate your personal market view "tailor made" with our innovative products.
Text und analysis Florian Franz
Partner at Carat Solutions AG
The chart provides you the development and correlation of the VanEcks Oil ETF and SPDR Gold Shares :